

Vertex AI is Google’s platform offering AI and machine learning computing as a service—enabling users to train and deploy machine learning (ML) models and AI applications in the cloud. In June 2023, Google added generative AI support to Vertex AI, so users can test, tune, and deploy Google’s large language models (LLMs) for use in their applications.
We’re pleased to announce that Datadog now integrates with Vertex AI, helping you track the health and performance of your LLM-powered services in production. In this post, we’ll discuss how you can leverage the integration to track and alert on key Vertex AI metrics, including network traffic, prediction errors and latency, resource utilization, and more.
Understand your ML models’ efficacy and your AI infrastructure’s health
Once you’ve connected your Vertex AI and Datadog accounts and set up the integration, you’ll be able to view metrics from any of your Vertex AI deployments in Datadog—including performance signals, resource utilization, network traffic behavior, and the scaling of workers. You can view all these metrics at a glance by using the included out-of-the-box dashboard.
Firstly, it’s important to monitor the standard RED (rate, errors, duration) metrics to understand the performance of your model in your production environment. You need visibility into how many successful predictions your model is making in a given time span, along with prediction errors and latency. If your prediction count is low but other health signals are normal, this can be a sign that your model needs to be retrained, or that it’s receiving malformed data.
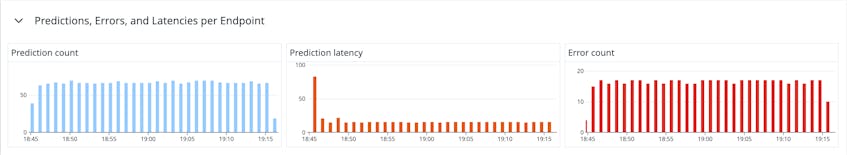
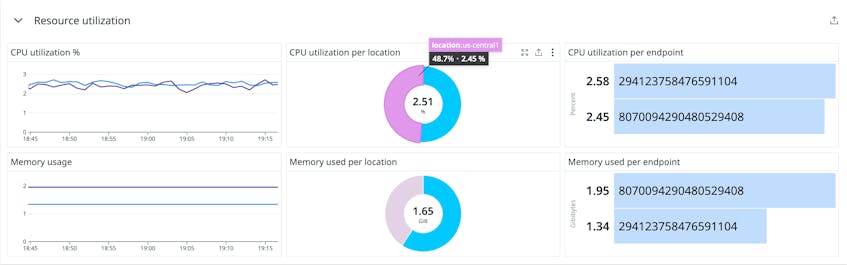
However, if the observed low prediction count is correlated with increased errors and/or latency, this could indicate underlying infrastructure issues. The dashboard also provides CPU and memory utilization metrics side-by-side, so you can spot at a glance when your Vertex AI workers need to be scaled up. The graphs break this infrastructure data down by location, so you can understand when particular cloud regions are receiving a disproportionate volume of requests (or experiencing outages).
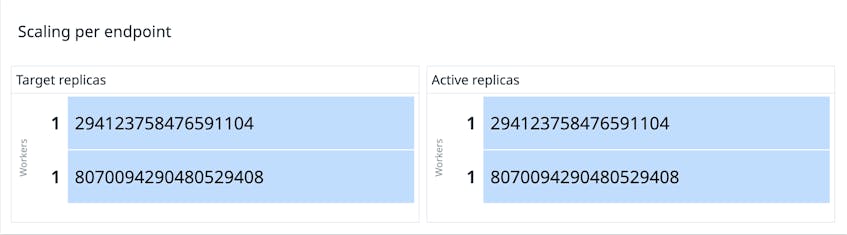
To further understand the scaling behavior of your workers, you can also monitor your deployment’s active replicas from the dashboard. By examining the currently active replicas, you can quickly identify when the target replica count needs to be increased in order to add more workers.
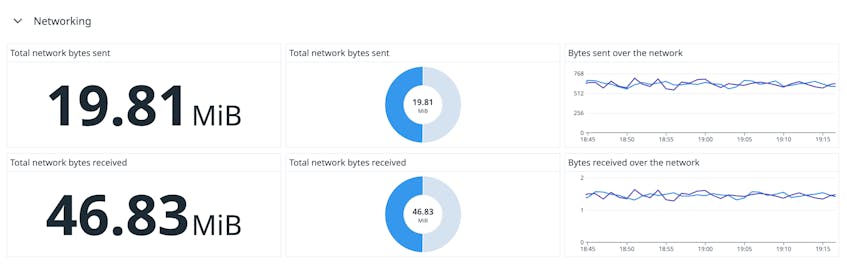
Finally, the dashboard also helps you monitor your Vertex deployment’s network traffic for visibility into egress costs. This data is also broken down by region to tell you which locations are contributing the most bandwidth consumption. By monitoring all these metrics together from a single pane, you can form a holistic view of your Vertex AI deployment’s behavior, quickly spot issues, and begin to interpret their root cause.
Get alerted of new issues with your AI services
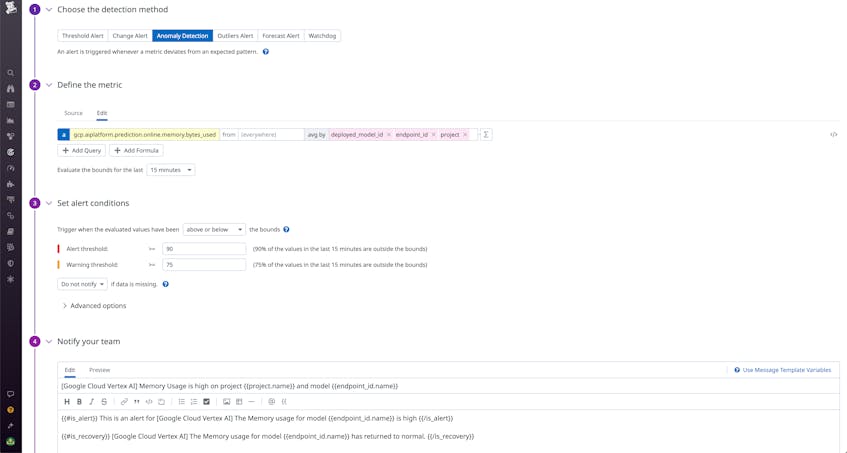
By enabling you to create monitors on your ingested Vertex AI metrics, the integration helps your team respond to issues in real time by issuing prompt notifications to relevant stakeholders. The integration includes recommended monitors that help you stay abreast of incidents.
Firstly, we recommend that you monitor for anomalies in your deployment’s memory usage. This will enable you to get notified when memory usage starts increasing rapidly and potentially causing errors.
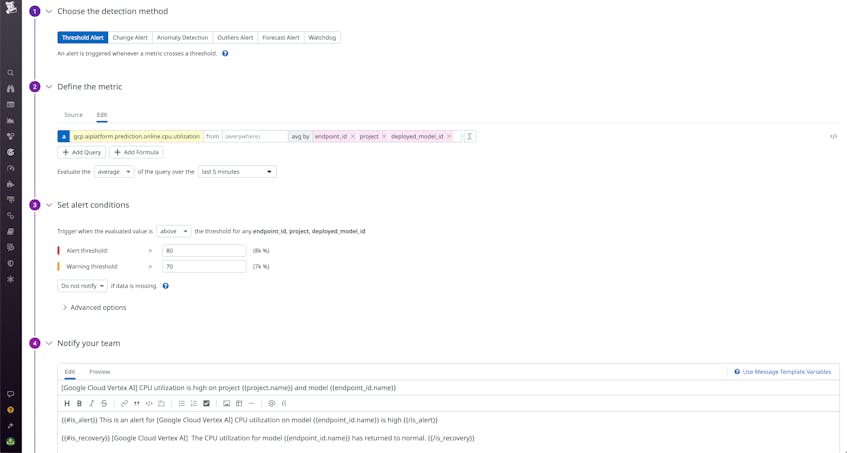
Next, we recommend monitoring CPU utilization as a percentage. You can correlate both CPU and memory usage metrics with error and latency metrics to quickly spot when resource overconsumption is leading to degraded performance.
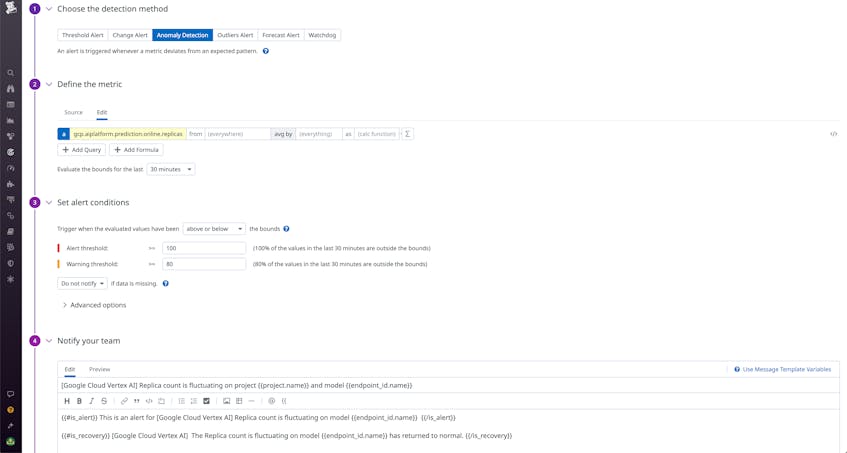
Finally, we recommend monitoring for anomalies in your deployment’s replica count. By staying abreast of fluctuations in the number of active replicas, you can ensure that your worker pool remains at a manageable size and also spot when your training jobs are starting to require an unusually large amount of resources.
Get visibility into your generative AI-powered services
As more and more AI models are launched into production, it’s more important than ever to monitor them and ensure that they perform accurately and efficiently. Datadog’s Vertex AI integration makes it easier than ever to get visibility into the health and performance of your generative AI-powered services. For more information about this integration, see our documentation. Or if you’re brand new to Datadog, sign up for a free trial to get started.
